Reader.id
For networking based on similar subscription interests. I worked on the app solo as a designer to decrease churn rates and simplify subscription management.

Goal
To keep the app churn rate at or below the benchmark.
Reader.id helps manage media subscriptions
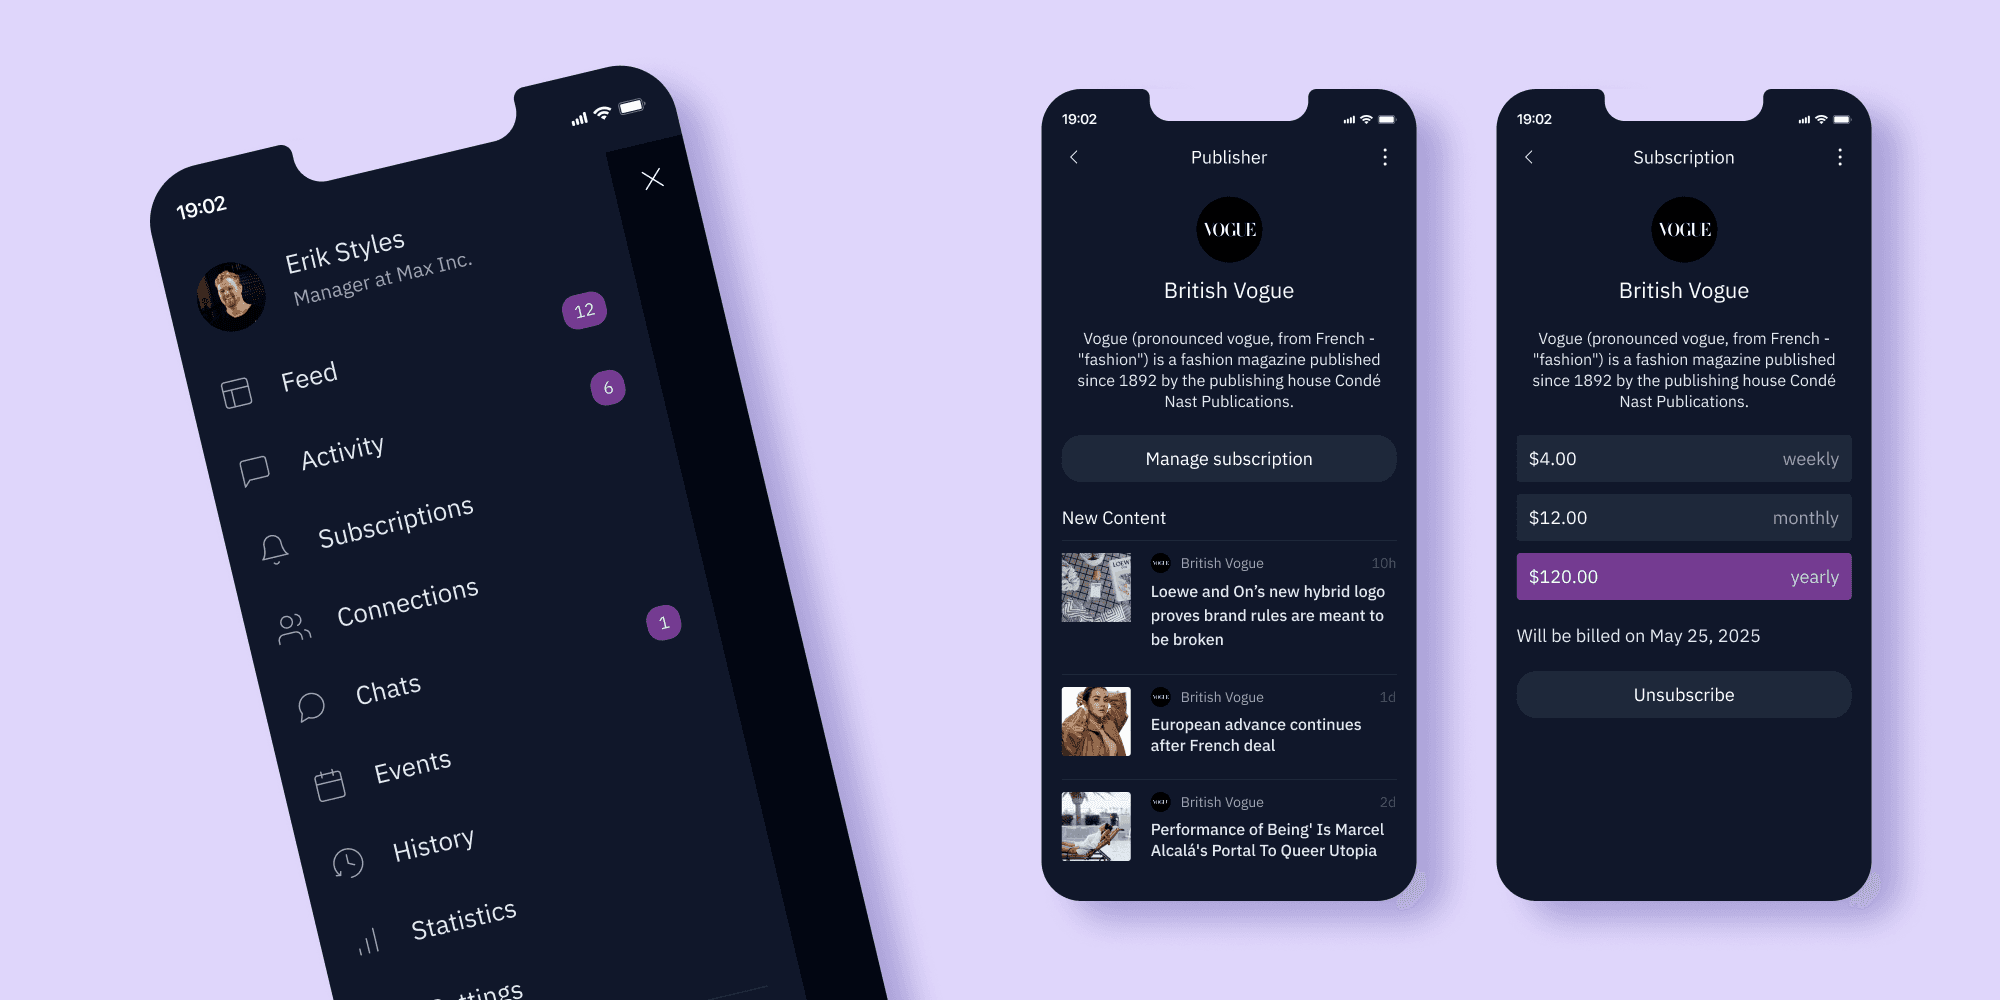
View all articles from one source.
Subscribe and unsubscribe with minimum taps.
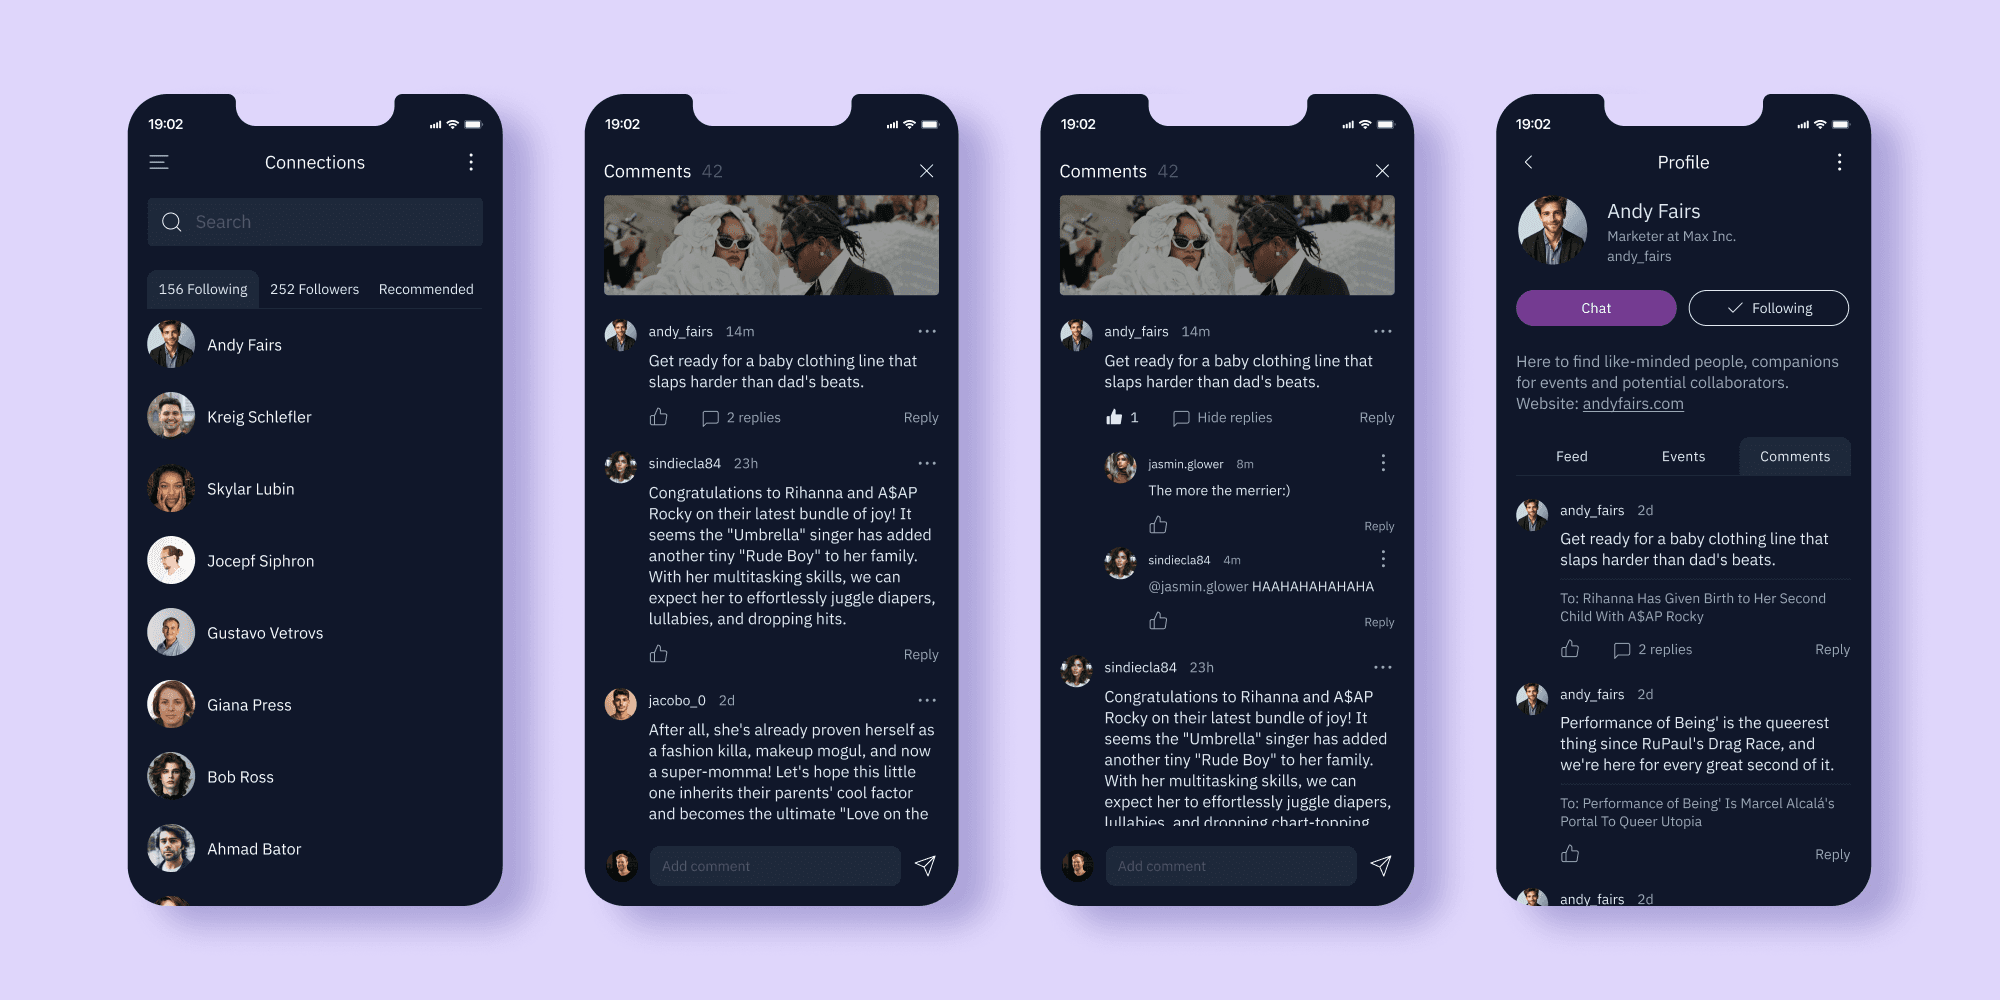
Find people with the same interests as you in the comments to the articles.
Buy tickets to events organised by publishers and meet them in person.
Typical churn rates in the industry
Media and entertainment is 20%–30%.
Online retail subscriptions: 15%–20%
Fitness and wellness: 10%–15%
SaaS (software-as-a-service): 5%–7%
Telecommunications: 2%–5%
Source: Stripe, Customer churn explained.
As you can see, media and entertainment have the highest churn rates, making churn a particularly significant topic for this app.
Work scope
To achieve the goal, the following actions were taken.
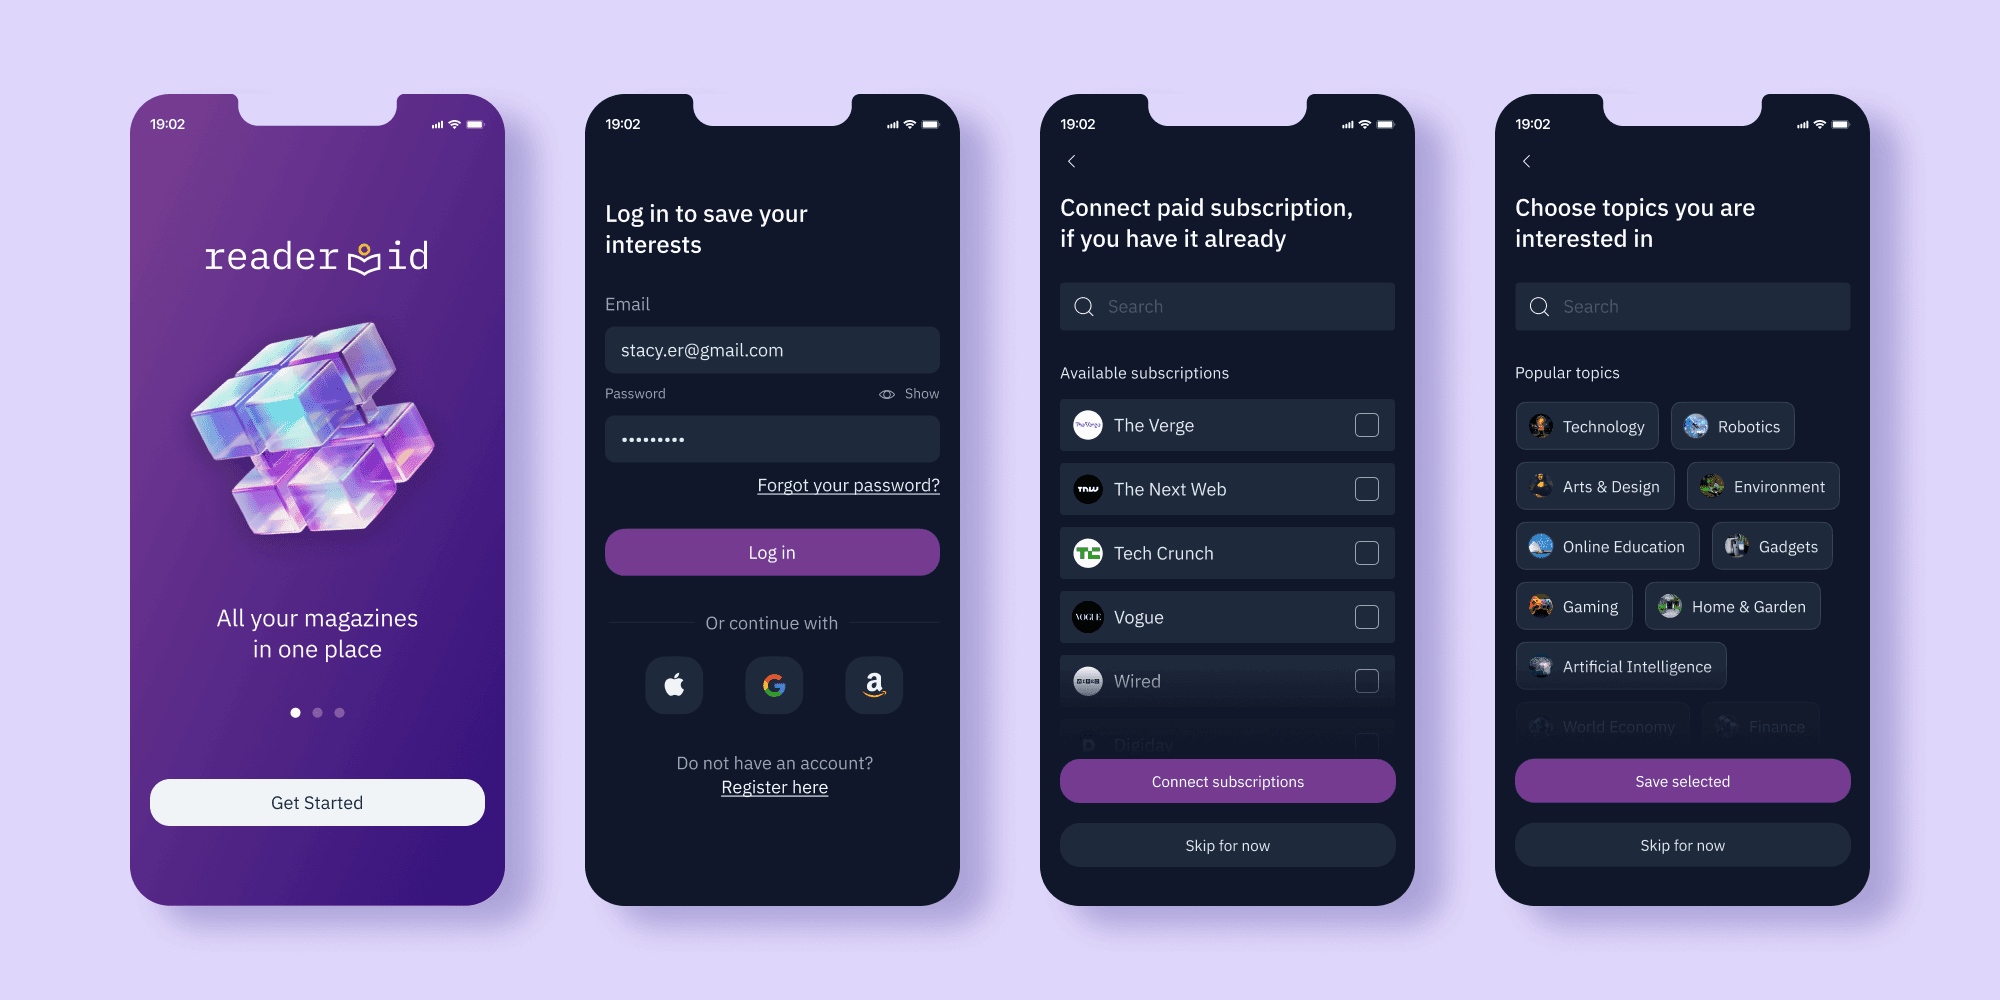
Simplified onboarding
Instead of 20 inputs to fill, like on publisher websites, we have quick login, possibility to connect existing subscriptions and topics to choose for recommendations.
Streamlined navigation
With so many options in the app, keeping them neatly in the sidebar has proven to be a working way. Each of the flows has 1-5 screens, making it easy to find the needed feature.
Fostered connections
I added social features like commenting and following to build a community. Authors get valuable insights, readers share them. Replying to a witty comment is a great way to start a conversation with a new acquaintance.
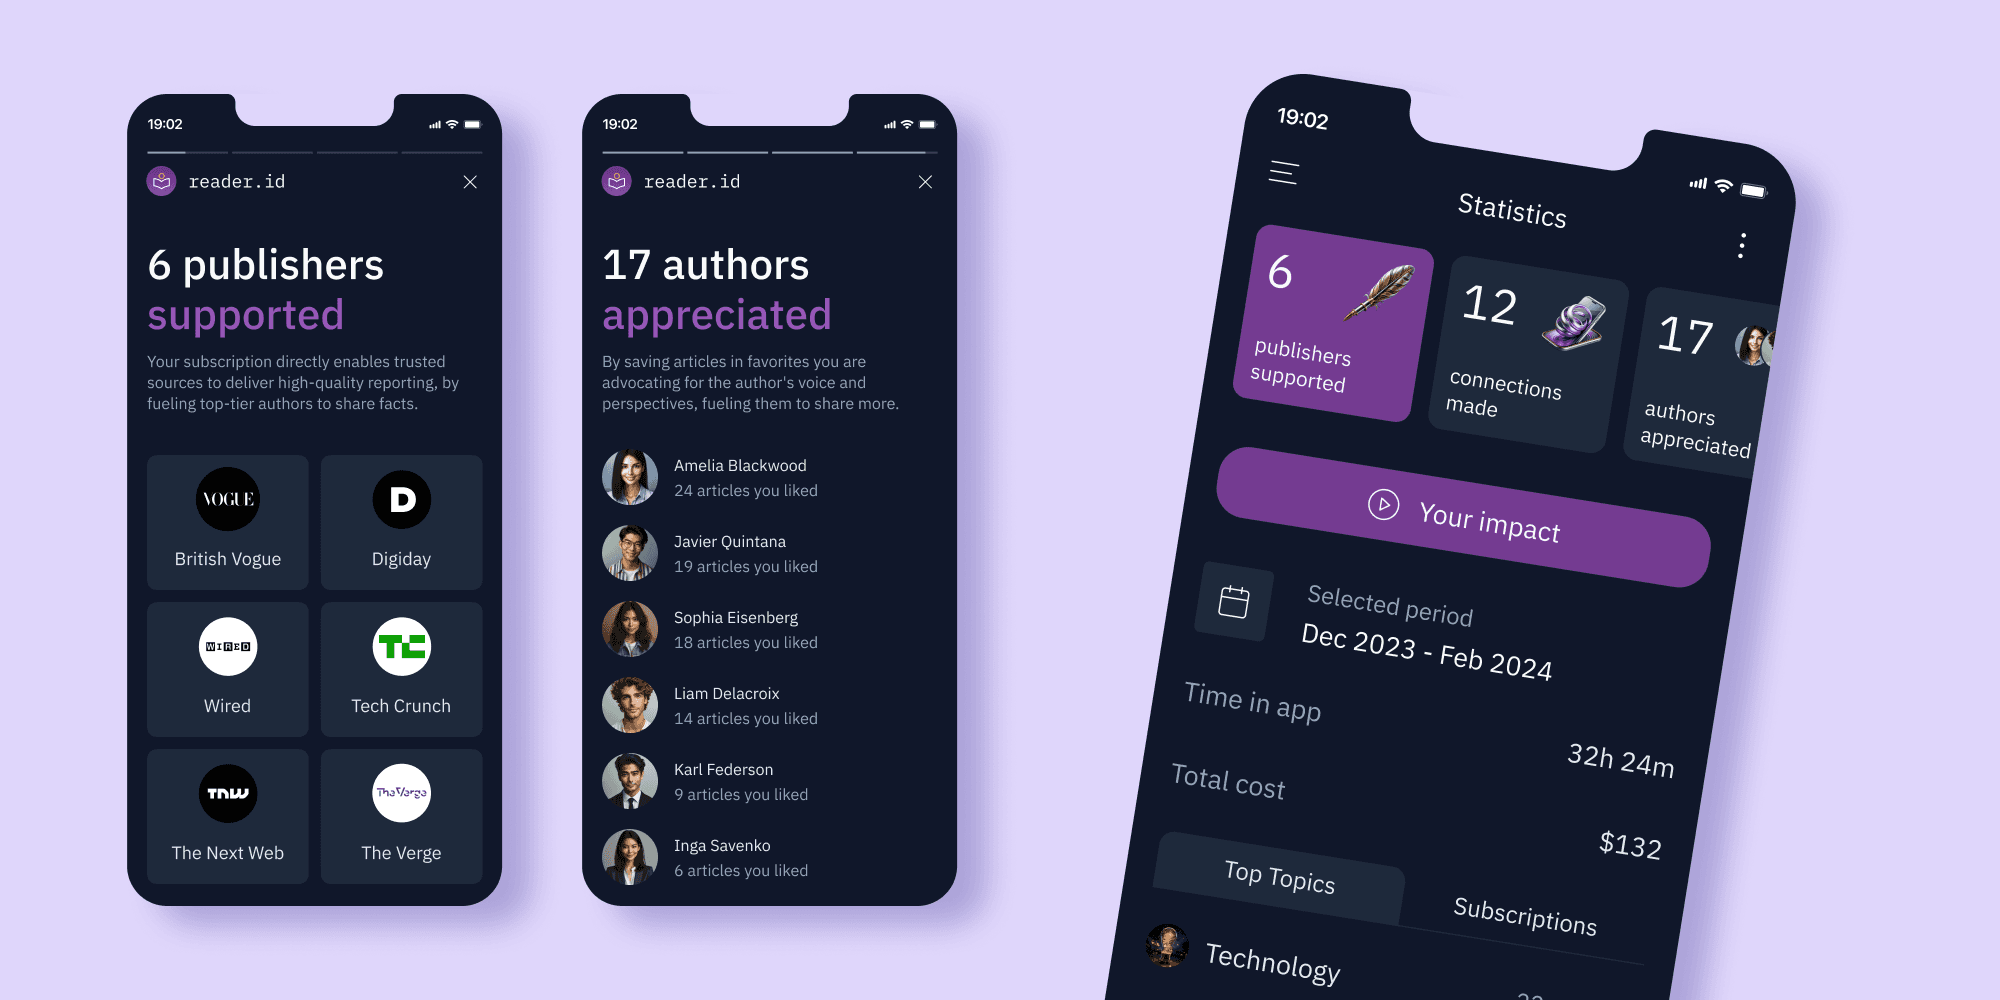
Showed subscriptions impact
Subscribing to the publisher is often a gesture of support for quality journalism. The app is showing subscribers the impact of their support to make them feel valued.
Tools
Design | Figma |
|---|---|
Illustrations | Midjourney, Recraft |
Research | Perplexity |
Results
Simplifying the onboarding process, fostering connections, and showing the impact of subscriptions made it easier for users to achieve their goals, discouraging them from abandoning the app.
Churn rate in 3 months was 20%, according to Firebase data.
Benchmark churn rate for Media and entertainment is 20%–30%. Observations were conducted in the focus group. Each of the users had access to the app via email invitation, as part of the early access program.
Credits
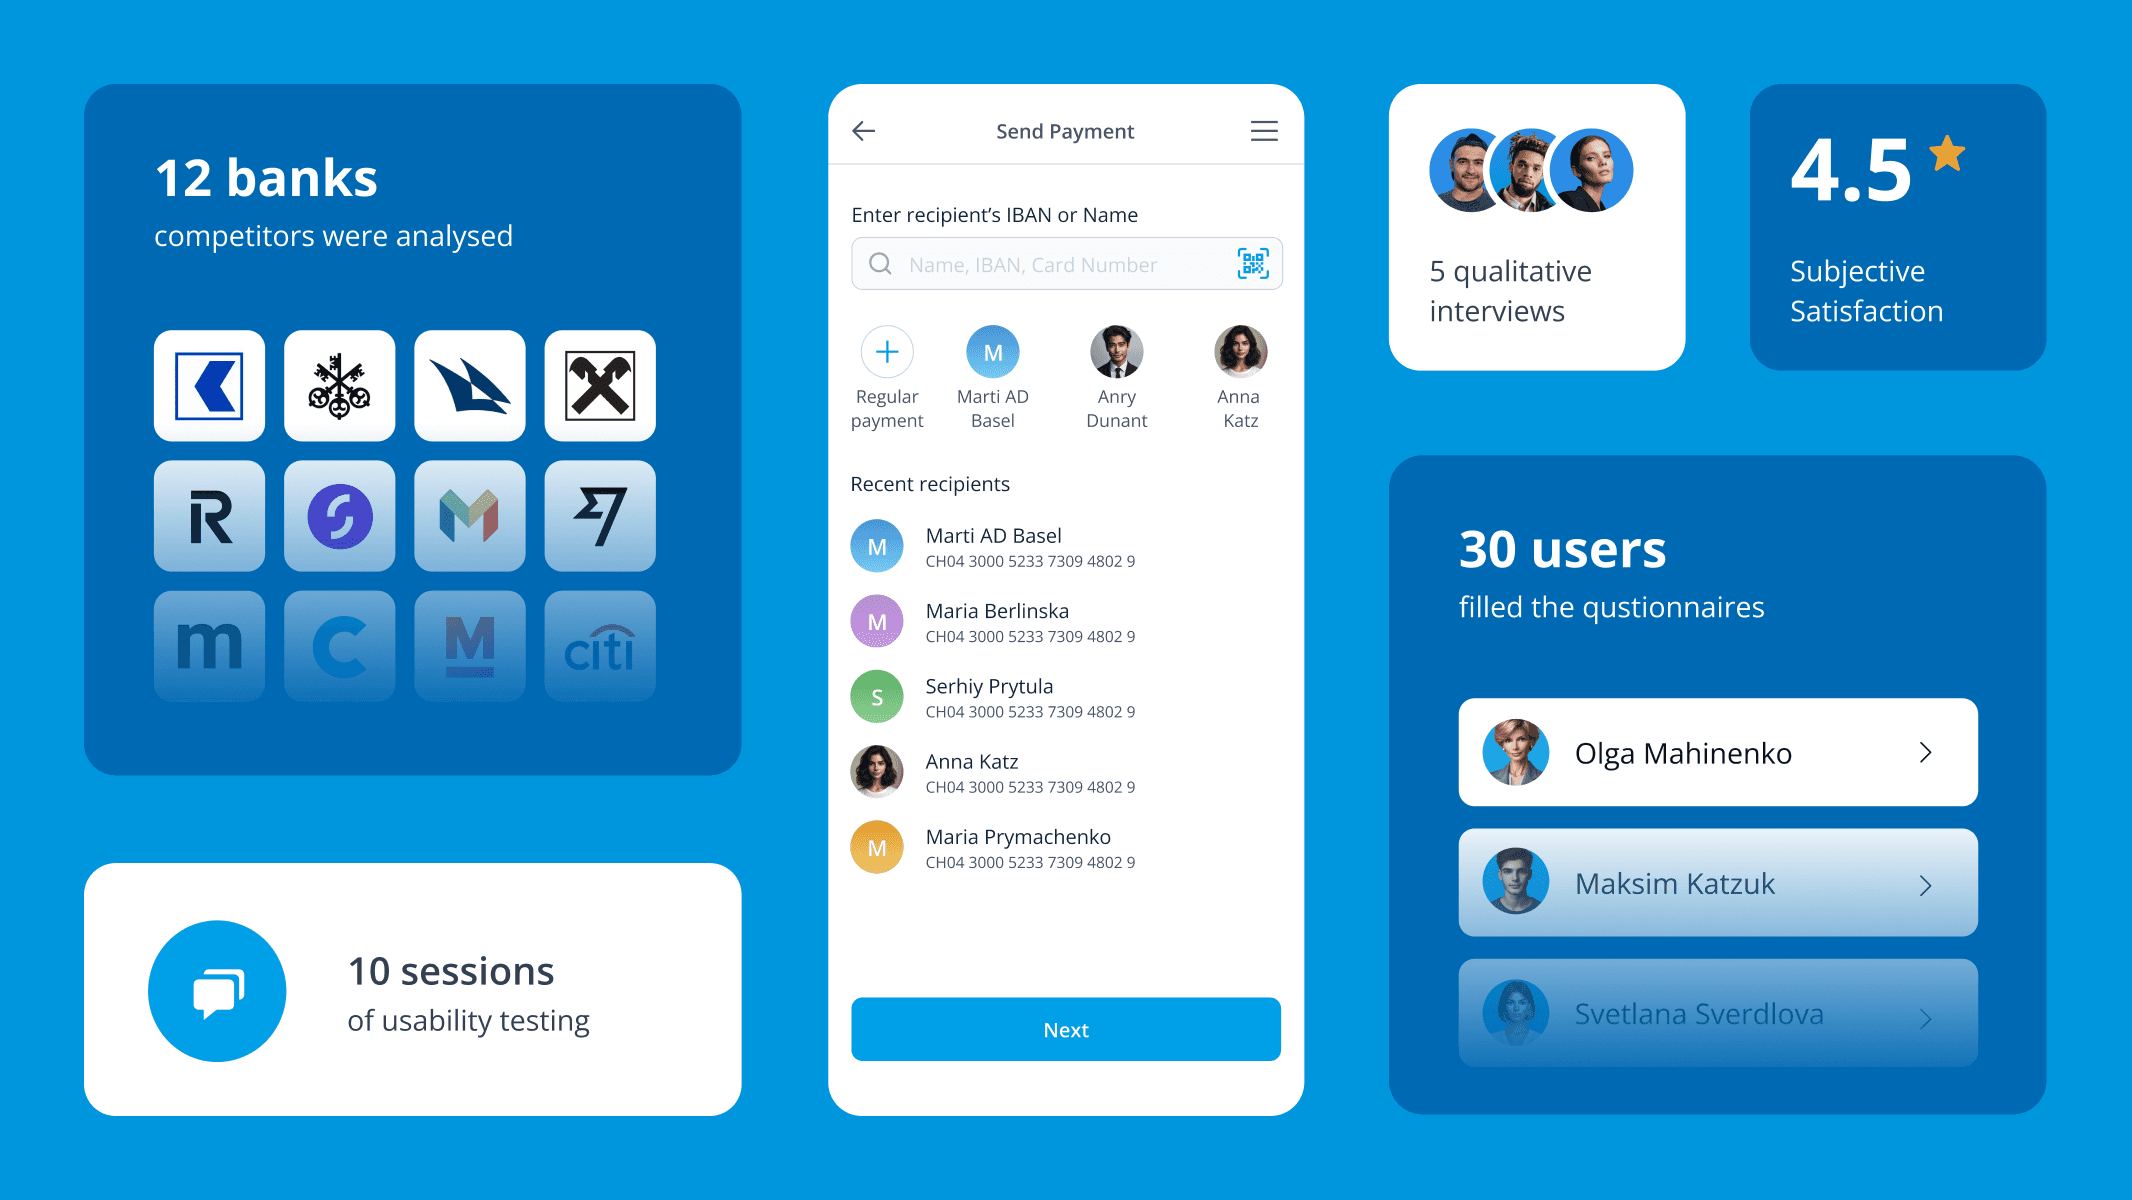
Anastasia Isachenko — UX/UI Design, Branding, Copywriting, User & Competitor Research, Usability Testing (6 months)
Grandiz Agency — Software Engineering and Project Management